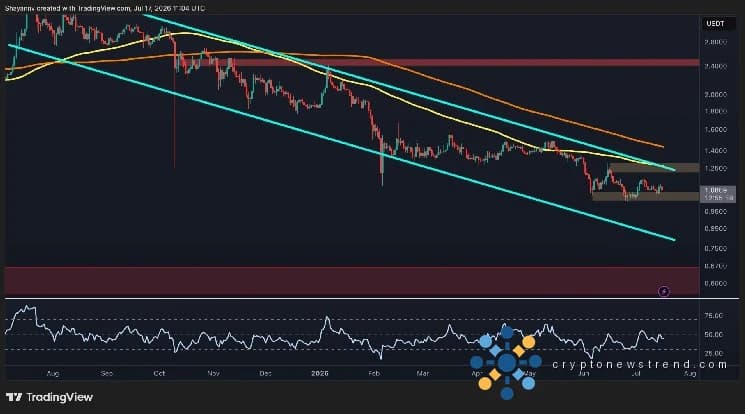

Ripple’s XRP stabilized above the $1 mark on the USDT chart, trading near $1.08 after a prolonged decline that began with the sharp June breakdown.
Technical Overview of the XRP/USDT Pair
The daily chart shows XRP confined within a descending channel, with the price lingering just above the $1 support zone while struggling to breach the $1.25 resistance level. Both the 100‑day and 200‑day moving averages slope downward, keeping the asset below these key benchmarks and reinforcing a bearish market bias. RSI hovers around the 50‑point mark, indicating limited momentum and a lack of decisive buying pressure.
Behavior of the XRP/BTC Pair
Against Bitcoin, XRP continues to produce lower highs and lower lows, underscoring its relative weakness in the broader crypto market. The pair remains trapped beneath the descending channel’s upper boundary, and each attempt to reclaim the 100‑day moving average meets immediate rejection. Investors monitor the BTC pairing closely, as further downside could signal intensified selling pressure across the blockchain sector.
Future Outlook and Potential Triggers
A decisive break above the $1.25 resistance would represent the first clear sign of buyer resurgence, potentially exposing the channel’s upper limit as the next target. Conversely, a slip beneath the $1 support could unlock deeper demand zones, exposing the price to further declines. Market participants remain attentive to any macro‑economic shifts or regulatory news that might sway investor sentiment toward this crypto asset.